Testing Power, 1940 to 2026: Stories, Changes, and a Technical Guide
This page has two parts — recollections from Marc Rozman, as told to David Zatz, and a technical discussion from engineer Mike Dodge.
Personal recollections
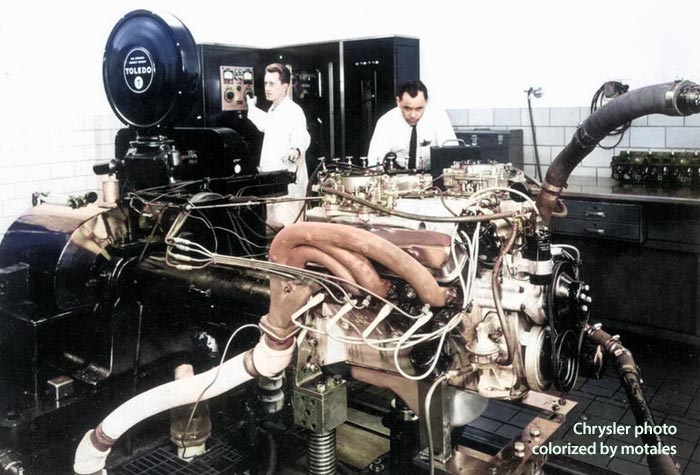
Photo: Ken Heatlie and Bob Lectner testing 426 Max Wedge in Cell 48 (courtesy Marc Rozman)
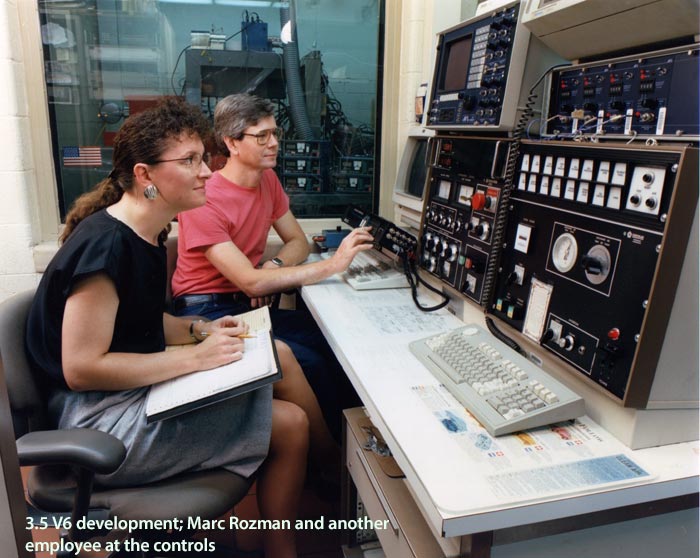
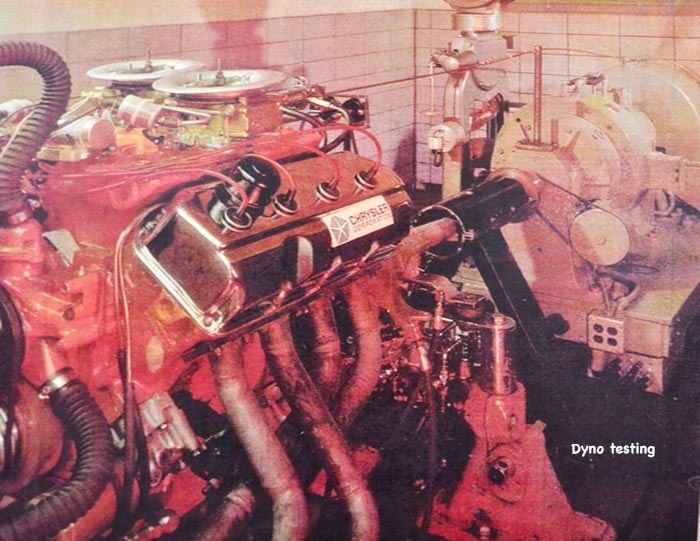
Until the 1990s, Chrysler Corporation’s old headquarters in Highland Park included old test cells for engine development and power measurement. The operator stayed in the cell with the engine, in most of them. Marc said, “once engines got more powerful, there was more chance of breakage, parts flying around. There’d be fires and such ... you’d have an instant oil fire. ... depending on how fast you are and how healthy you are, you can get out pretty quickly and pull the plug on the fire extinguisher.”
He started in cell 6A, next door to 7B, which had been adapted for NASCAR engines. Ramcharger engineer Mike Buckel told Marc that that they’d recorded NASCAR track racing cycles on punch cards and computer tape, high tech for the time, so they could test engines under race conditions. The cell was abandoned when the program was over.
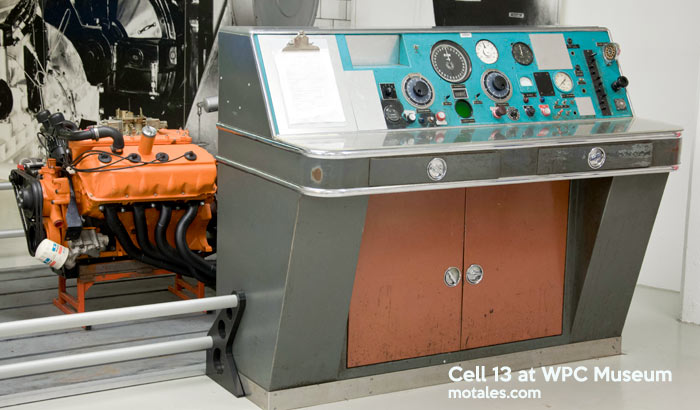
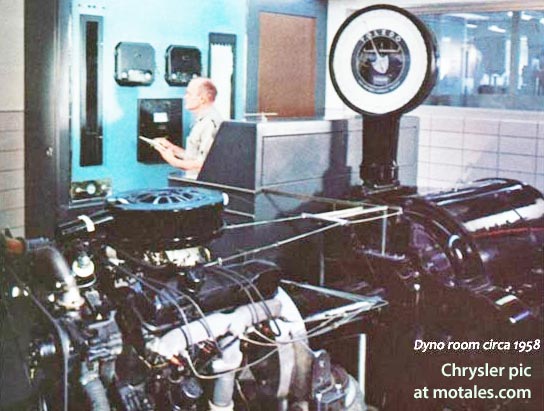
Five cells were for advanced design, such as turbines and diesels. Two were were single-cylinder setups to develop combustion chambers—this is how Chrysler ended up with the Hemi back in 1951, and then with the Wedge a few years later. One was for transmissions, three were antique amplidyne setups (generating power while testing), and Cell 11 was used to measure horsepower. Two cells ran EPA certifications when Marc was there; and Ed Poplawski ran the 355 V8 for drag racing. Just two cells protected the operators with a wall and glass.
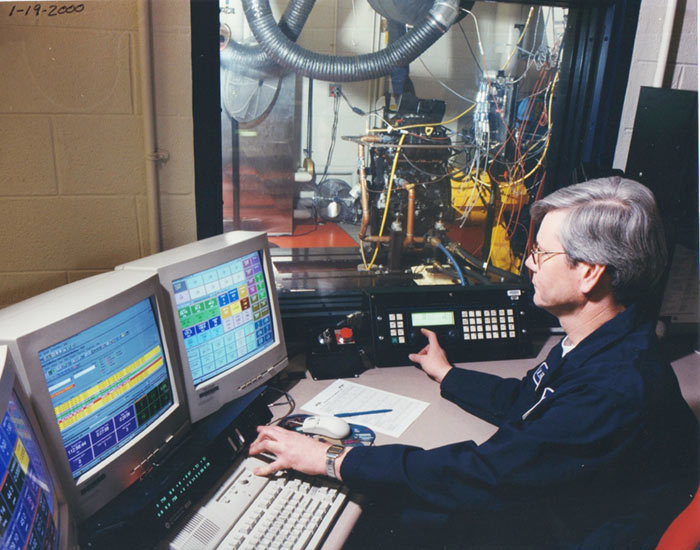
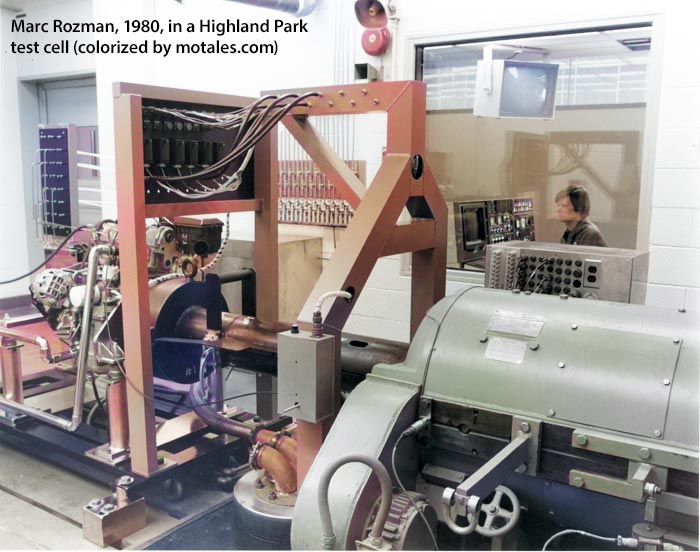
Marc was the first operator in the new Chrysler Technical Center; he helped get the area running. The building was well-designed, and the first large-scale use of computers, to the point that they could change engines in 15 minutes. The cells were arranged in sets of four, called quads, and they tried to get the same platform or group into the same area. “Thermo cells” could heat or cool the oil, water, and air going into the engine for testing performance under different conditions. The cells were designed to be more open—as Marc said, “You can socialize a lot more, which is good not only for work but for just staying awake.”
Editor’s note: Some retired Chrysler executives said that “marketing horsepower” was often used in the pre-1972 days. This could just be rounding to the nearest 0 (e.g. from 147 to 150 bhp), or dropping the power of one engine and increasing the power of another to encourage customers to pay for the option (this was allegedly done with the 170 and 225 slant sixes), or just for competitive advantage (when Ford took over Willys’ operations in one country, they reportedly raised the stated power of the engines with no actual changes).
Powr: What Engineers Measure, What Enthusiasts Argue About, and Why the OEMs Stick to Crank Horsepower
Executive summary (for people who have cars to build)
- Crank horsepower (“net engine power”) is measured on an engine dyno under tightly controlled, standardized conditions (e.g., SAE J1349; UNECE R85/ISO 1585 in many markets). That’s the number OEMs advertise because it’s repeatable, certifiable, and comparable.
- Rear-wheel horsepower (RWHP) is measured on a chassis dyno, with the entire driveline in play. RWHP is great for tuning changes, not cross-car comparisons. It varies with dyno type, setup, strapping, tires, transmission state, correction method (SAE vs “STD”), and operator choices.
- Standards matter. SAE J1349 corrects to ~25 °C and ~99 kPa dry air; “STD/J607” corrects to 60 °F and 29.92 inHg and typically reads a few percent higher. Don’t compare SAE-corrected crank to STD-corrected wheel—ever.
- There’s no single “drivetrain percent loss.” Losses are speed/load dependent (viscous, churning, gear mesh, bearings, hypoid sliding, converter slip). The popular “15% rule” is a forum simplification, not physics.
- Regulators and certifiers live at the crank. Emissions mapping and certification use engine dynos (40 CFR Part 1065). Wheel power for electrified powertrains is being standardized by SAE J2908, but traditional ICE ratings remain crank-based.
Precise definitions (and the standards behind them)
Crank horsepower (net engine power)
- Measured at the crankshaft on a lab engine dyno with the as-installed accessory load (e.g., production intake, exhaust, alternator) under reference conditions, then corrected to a standard atmosphere. The globally used specs are:
- SAE J1349 (Net Power): Defines reference inlet air/fuel, correction method, and test setup for as-installed net power in North America.
- UNECE R85 / ISO 1585: EU/UN procedures for net power; explicitly lists reference atmosphere: 25 °C, 99 kPa dry pressure (100 kPa total – 1 kPa water vapor).
- SAE J2723: How to certify advertised power to J1349/J1995. This is why brochures are internally and externally auditable.
- SAE J2908: for electrified vehicles, this provides maximum wheel power and rated system power for cross-vehicle comparisons. It’s the beginning of an industry-sanctioned “wheel power” language, but internal combustion engine advertising remains crank-based for the reasons in the next section.
Gross power / brake horsepower (legacy): SAE J1995 measures power with minimal accessory load (historically, pre-1972 “gross” ratings). It’s not used for modern passenger car labels or advertising, but remains a defined test code. [Editor’s note: 1971 was the only year every automaker in the United States listed both numbers, gross and net. This is a good basis for reasonable comparisons and understanding 1960s power ratings in more modern terms, except that automakers tended to play marketing games with the numbers in those days.]
Rear-wheel horsepower (RWHP):
Measured on a chassis dyno (inertia or load-controlled eddy current/hydraulic). Includes drivetrain losses and test-stand losses (tires/rollers, straps). Software then applies correction factors (SAE, DIN, EEC, or “STD/J607”) that materially change the printed numbers.
Why OEMs publish crank numbers (metrology, certification, comparability)
- Repeatability and comparability. Engine dynos eliminate the vehicle-level variables. J1349/R85/ISO 1585 define the same atmosphere and instrumentation so a 500 hp rating means the same thing in Detroit and Stuttgart.
- Regulatory coupling. Emissions development is executed on engine dynos with engine maps (brake torque vs speed) as the backbone. See 40 CFR 1065.510 and related sections that prescribe mapping and dynamometer control at the crank.
- Certifiable claims. If an OEM says “Certified to SAE J1349,” there’s a formal trail (J2723) behind that number. RWHP has no such certification framework.
- Engineering workflow. Powertrain teams work from brake torque/power at the engine first; vehicle integration follows. Publishing the engine figure aligns with how engines are designed, tested, and regulated.
The correction-factor minefield (SAE vs “STD/J607” vs DIN/EEC)
- SAE J1349 (Net): Corrects to ~25 °C and ~99 kPa dry (equivalently ~29.23 inHg minus ~1 kPa water vapor). Conservative vs “STD”; closer to real ambient use.
- “STD” (J607 legacy): Corrects to 60 °F, 29.92 inHg, historically without humidity correction—tends to read ~3–4% higher than SAE on the same pull. Many tuning shops prefer it because… bigger numbers.
- DIN/EEC (EU variants): Close to SAE net concepts but with different formula details; software options on many dynos. Don’t cross-compare across standards.
Rule: Always print which correction and smoothing were used. Dynojet/Mustang software exposes these settings; hiding them is a red flag.
What “drivetrain loss” actually is (and why it isn’t a fixed percent)
Components of loss (all speed/load dependent):
- Hydrodynamic and churning losses: Oil shear in gearsets, splash, pumps—grows with speed.
- Gear mesh and hypoid sliding: Hypoid final drives have notably lower efficiency than spur/helical; each mesh takes a bite.
- Bearing and seal drag: Sensitive to preload, temperature, and lubricant.
- Torque converter slip: Until lockup, it’s a literal blender—efficiency rises with turbine speed ratio, then locks.
- Tires/rollers and strapping: Contact patch hysteresis, tire temp/pressure, strap tension, roller diameter/surface, hub vs roller dyno choice.
Implication: A “fixed 15–20% loss” is an oversimplification. Losses scale with operating point and test stand details. MotorTrend/Modified summed it best: stop trying to back-solve crank from wheel with a single percentage. Use RWHP for within-car deltas (changes).
Why chassis dynos disagree (and how to make them behave)
Dyno hardware
- Inertia dynos (many Dynojet units): repeatable ramps, but load profile is dominated by drum inertia.
- Eddy-current/hydraulic load dynos (Mustang, Mainline, Dynapack): can hold steady state and apply custom road-load, superb for calibration but sensitive to control setup.
Setup variables that swing RWHP
- Tire pressure and temperature, strap tension/angle, roller surface and diameter.
- Gear selection (gear ratio → roller speed → losses), converter lockup state, traction control and torque management still active.
- Smoothing and correction options in software. (If the operator won’t disclose them, find another shop.)
Hub dynos remove tire/roller effects and can improve repeatability, but still include driveline losses; they’re not crank dynos.
Converting RWHP ↔ crank HP: the only honest way (with uncertainty)
Don’t multiply by a percentage. If you must estimate:
- Measure RWHP with best-practice controls (see the next section).
- Quantify driveline state: manual vs auto (locked/unlocked), axle type, oil temps.
- Use a model: account for speed-dependent viscous/churning losses and hypoid efficiency (use published efficiency bands and sensitivity).
- Publish uncertainty: ±(3–8%) is realistic even on a well-controlled setup; more if converter never locks or tires are marginal. (If the estimate yields a single “exact” crank number, someone’s selling you something.
Regulatory coastdown methods (for emissions/road-load setting) show how speed-dependent forces are modeled—quadratic with speed—which is why a flat percent is wrong.
Master Black Belt checklist: a dyno MSA you can trust (repeatability first, then comparisons)
Objective: Make your dyno a measurement system with known capability (GR&R mindset).
Pre-test controls
- Fluids at temp: Engine oil, coolant, transmission, and axle lube stabilized; verify converter lockup strategy.
- Tires: Same brand/size, set cold, note temp rise; disable TPMS torque cuts if applicable.
- Electronics: Force a repeatable mode (Dyno/Track), disable traction/ESC, confirm no power limiters.
- Gear: Use the closest-to-1:1 gear (minimizes internal multiplication and speed).
- Ambient logging: Temp, pressure, humidity → SAE J1349 correction in software; do not mix SAE and STD across runs.
Run protocol
- Warm-up pulls to stabilize temps, then 5 back-to-back measured runs.
- Hold start and end speeds consistent; fixed ramp rate or fixed load—don’t mix methods mid-test.
- Record correction method, smoothing, gear, strap layout, tire pressure, software version.
Acceptance
- Short-term repeatability: Standard deviation of 1% or less of mean RWHP across 5 runs. If it is greater than 1.5%, fix your setup before changing hardware.
- Between-day repeatability: less than 3% after re-setup under similar ambients.
- Gauge R&R: Operator and setup variation contributions each under 30% of total observed variation. (If not, you’re not ready to compare parts or calibrations.)
Reporting: Always publish RWHP + correction (SAE/DIN/STD), smoothing, gear, converter lockup, and 95% confidence interval, based on your repeated runs.
Myth-busting quick hits
- “My Dynojet reads higher than his Mustang, so my car is faster.” Different hardware/control philosophies. Use one dyno, one method for development deltas.
- “STD vs SAE doesn’t matter.” It’s 3–4% on the same pull. It matters.
- “OEMs lowball; my RWHP proves it.” Comparing corrected crank to corrected wheel power with undefined loss and test-stand artifacts does not work. The OEM number is backed by J1349/J2723.
- “Percent loss is constant.” Losses scale with speed/load and hardware. Hypoid axles alone can swing efficiency several points.
Why this all translates to better decisions
- If you’re an OEM: Stick to J1349/R85/ISO 1585 for published ratings; it keeps Marketing honest and Engineering aligned with certification workflows.
- If you’re a tuner or racer: Treat RWHP as a process metric for your car only. Lock your method, prove repeatability, then believe deltas (changes), not absolutes.
- If you’re benchmarking competitors: Either:
- (a) buy the engines and run J1349-compliant engine dyno tests, or
- (b) perform tightly controlled chassis testing with a documented uncertainty budget. Anything else is bench-racing.
Useful primary references
- SAE J1349 (Net power): scope, reference conditions, correction.
- SAE J1995 (Gross power): legacy/gross rating method.
- UNECE R85 / ISO 1585 (Net power, EU/UN): reference atmosphere and correction formulas (25 °C, 99 kPa dry).
- SAE J2723 (Certified advertised power procedure).
- EPA 40 CFR Part 1065/1066 (engine vs chassis test frameworks; engine mapping on dyno).
- Dyno control/software (corrections, smoothing): Dynojet PowerCore documentation; Mustang Dyno control manual.
- Loss mechanics (gear/hypoid/bearing efficiency; why percent loss is a myth).
Mark Dodge verdict: Crank HP is the currency of engineering and regulation. RWHP is the shop-floor truth for your specific car and test stand. Translate between them with standards, not folklore—and publish your uncertainty like a grown-up.
